I occasionally create audio mixes of old disco/pop/dance songs to play at parties. I shared on of them on YouTube a few years ago and to my astonishment, the number of views has increased from 1000 to almost 750,000.
So I’m making another video and I will post it as well to see what will happen. I’m considering the layout shown in this extract:
(Best viewed full screen at 1080p)
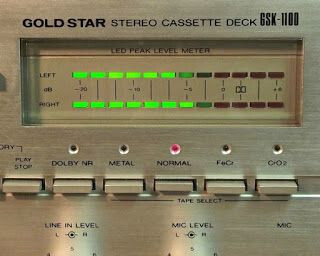
In Shotcut, I used the Audio Spectrum Visualization filter and the Mask: From file filter to overlay fake LEDs on an image of the BDS PP-131 spectrum analyser.
A propos de ce filtre, il y a une autre anomalie (Bug ?) Réglez Type sur ‘barre’ Enregistrez et quittez SC Lorsque vous ré-ouvrez le projet, Type est réglé sur ‘line’
About this filter, there is another anomaly (Bug ?)
Set Type to ‘bar’.
Save and exit SC.
When you re-open the project, Type is set to ‘line’.
I changed it to 2 for the 21.12 release. But this does not simulate a VU meter because the two bars will represent different frequency bands, not different channels. Maybe I should also make an audio level visualization filter.
Thanks for your report. This is fixed for the 21.12 release.
That’s why I was suggesting we’d be allowed to show just one band. One Audio Spectrum filter for the left channel, one for the right channel and you have a stereo VU-meter.
Since the goal is to simulate, not emulate (often for just a short period of time), I don’t mind if the meter doesn’t show accurately the db level of each channel.
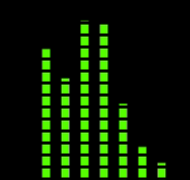
If you ever create that Audio level filter, would it be possible to add an option to adjust how accurate the bars are?
Meaning that you could set it, let’s say to 10 pixels, and the bars would go up and down in blocks of 10 pixels. That would prevent from producing fractions of LEDs when using a mask. Like you can see in this example:
Of course, that option would also be useful in the Audio Spectrum Visualization filter settings.
Also, there is a problem similar to the one reported above by @Namna concerning the Spectrum Color parameter.
I wouldn’t know how to code a spectrum analyzer or a VU-meter with Shadertoy and make it react to an actual music track in Shotcut. Plus, unless I’m mistaken, to use shaders, you need to be at least a bit familiar with a software like Natron. For the mere mortal, the Audio Spectrum Visualization filter is a lot easier to use in my opinion.
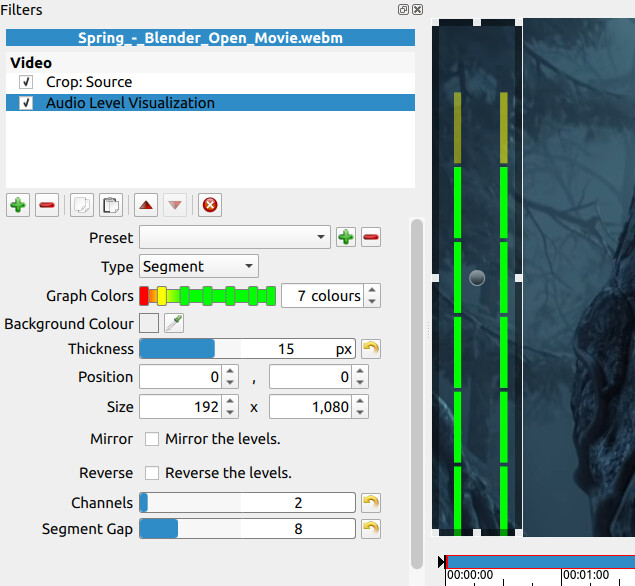
The new Audio Level Visualization has two types: Bar and Segment. The bar type is the same as the Spectrum Visualization Filter bar type. The Segment type is new. It divides the bar into one segment for each color specified. The segments to not have a gradient - they match the exact color specified by the user.
The “Segment Gap” setting sets the space (gap) between each segment. The “Thickness” setting modifies the width of each segment.
I also added the “Segment” type to the Spectrum Visualization Filter.