This topic is interesting to me. I should learn more about this.
I take back what I said about RMS. I was going off of memory since I knew we were using the MLT normalize module (based on the normalize command line tool, which is heavily based on RMS). However, upon looking it up, now I recall I added a separate filter based on code from a meter written by Steven Harris, who wrote the LADSPA plugins we include in Shotcut for many of the audio filters.
http://plugin.org.uk/meterbridge/
I think it is based on DPM.
Here is the MLT code Shotcut uses, which is easy to read if not entirely clear why some things are done. Shotcut sets iec_scale to 0 and instead does 20 * log10(audioLevel) for dBFS conversion.
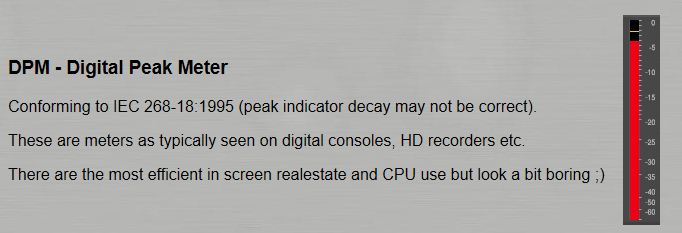
We already know what the reference standard for this digital peak meter is.
Before reading this (my fault), I spent the whole morning doing tests to try to find out what was the standard reference (or measurement) method with respect to the most common options that I have in my DAW and in my loudness meters.
I generated a sinusoidal 1kHz tone with Audacity to contrast the measurement with different standards. However, it did not match any of the VST analyzer plugins that I use.
With this new information, I observe that this IEC standard 268-18-1995 (1995), has already been overtaken by other standards such as ITU-BS.1770 (2015) or EBU R128 (2014)The loudness meters that I have used for the comparison are based on these last two standards, so they will hardly coincide.
This is neither good nor bad, they simply can not match.
This applies only to the peak meter, so we have the Shotcut loudness meter (LUFS) based on EBU R128.
The use of this tool can help to standardize our criteria at the time of editing the audio of our video.
I did not delve into the advantages of one or another measurement standard (the different algorithms, the different commercial needs, the different platforms and entities involved). For me, each regulation is focused on a situation and that is how it should be understood.
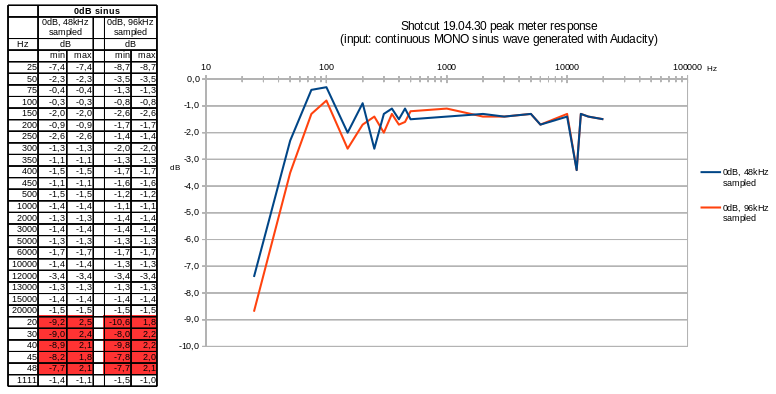
I made some measurements of the peak meter response with 0dB sinus inputs created with Audacity (0dB=level1 on the Audacity peak meter). I did not plot on the graph the frequencies which are not multiples of the frame frequency (PAL 25Hz) because for these frequencies, especially at low values, the meter response varies a lot according to the phase of the signal (see the last values in the table). As you can see there are significant amplitude variations, most of them probably due to the ringing of the high pass filter. Notice also the dip at 12kHz (submultiple of the sample frequency):
This already exceeds my limited knowledge about this (although these days I learned some things that I did not know).
Anyway for a more professional audio edition surely an external audio edition is a possible option.
For my modest and scant videos, the audio filters in SC work perfectly.
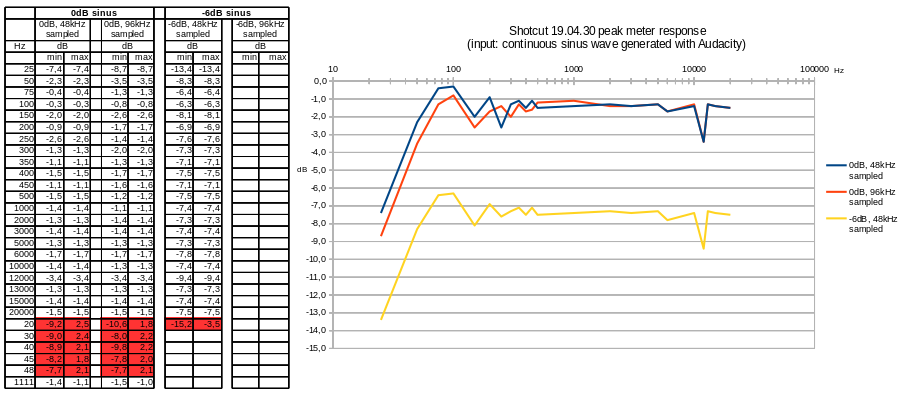
I have completed the testing with -6dBFS tones just to be sure there is no side effect of the high level tone (0dBFS). Also, the same important variations with tones which are not multiples of the frame frequency.
Surely I say some nonsense, but here I go:
Is it not possible that the measured final values (which are shown in the graph) are influenced by some algorithm that made an interpolation between the peak values in a sample?
I explain: In a sample of time X, at low frequencies, there are fewer phase changes than at high frequencies. Even some sine wave can be left without completing the peak and affect the final value of the measurement.
Also, the different measurement systems incorporate different characteristics (for example Attack time, Decay time)
Could this be a possible explanation or is it not related?
In values of high frequencies, the graph seems more stable.
The different standard measurement references use different filters (frequency and signal level) to eliminate extreme values to achieve a more accurate measurement.
Anyway, the graph represents the final value of the peak meter in Shotcut (which is affected by IEC268-18).
I did not find documentation on this regulation.
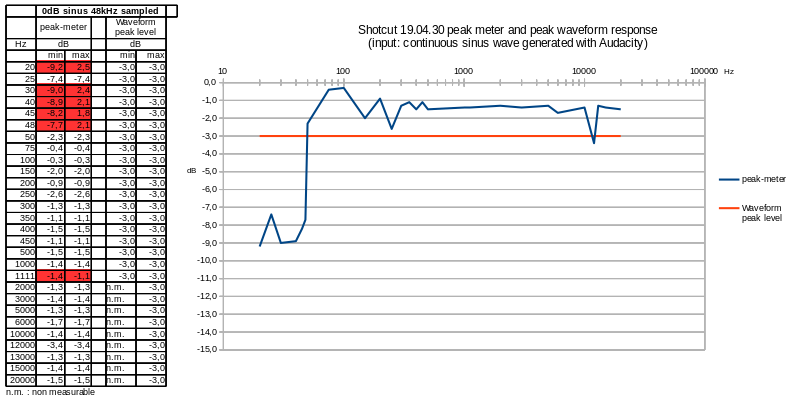
In this measurement I compared the peak-meter indication with the peak level of the frame waveform displayed by Shotcut. As you can see the waveform peak is perfectly flat, as it should be. But why is it at -3dB when the input signal is at 0 dB? These 3dB make me think of the peak to RMS coefficient… Note: above 1kHz there are artefacts in the displayed waveform probably due to the reduced number of samples to build it (n.m. in the value table).
This is probably due to the oversampling.
Interesting document. However, in 2004 these peak meters were quasi-peak with time constant. Nowadays it seems that we are in “the true peak meters” with oversampling (ITU-R BS.1770-4)…
So, after your tests, what conclusion do we have?
The peak meter in Shotcut (DPM):
Does it do its job well (with respect to the reference standard it uses?
If not, how can this affect our final audio?
Assuming that the DPM does not work properly (this is a hypothesis), is it possible to counteract this inconvenience by using the SC loudness meter (specifically the TPM -True Peak Meter value)?
Continuing with the hypothesis  :
:
If DPM is implemented from the source, as a simple form of visual reference, where possible errors (decay) are admitted, (reference: http://plugin.org.uk/meterbridge/ ) and is designed to maximize performance, perhaps all of this will affect greater accuracy and perhaps is not a high priority issue in the SC workflow (especially if the loudness meter already covers this issue).
As a field of experimentation, testing and comparison is an exciting topic.
However, in my case, if the loudness meter in SC works well, I think I can skip the DPM for a fine adjustment. But I can use it for a visual orientation on saturation.
However, this issue has no further path to assume that DPM used, has some inherent limitations due to its conception for low resource use (screen real-estate and CPU use) at the time it was designed (less powerful equipment).
I think today I already covered my quota of hypothesis 
Still experimenting… found another strange behaviour… coming back soon… please be patient!
Of course, I still gave the impression of being impatient.
I didn’t mean to. ![]()
My ignorance is bold and slips into my comments.
I will be attentive (but patiently) to your conclusions. ![]()
Thank you.
I just found why SC displays the peak of the frame waveform at -3dB when a 0dB tone is loaded: I was using mono test tones and, yes, with a stereo test tone the displayed waveform peaks at 0dB as it should! I don’t know what is causing this but my understanding is that this is a bug which can probably be easily fixed. I plotted again the frequency response of the peak-meter and the waveform peak:
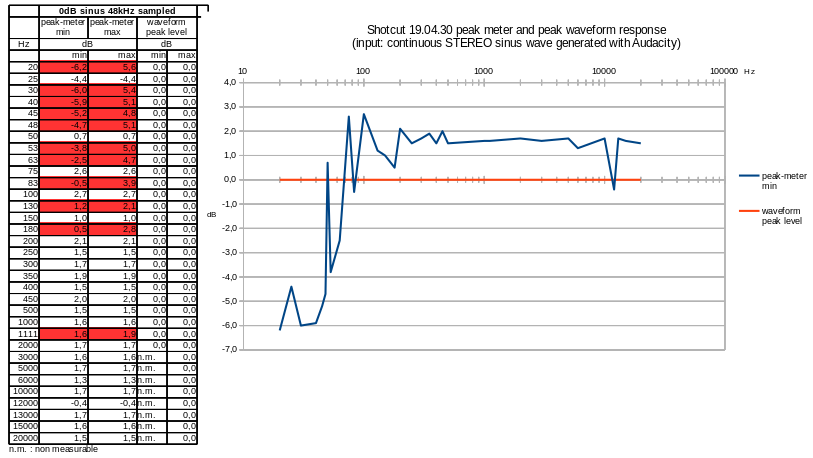
What this shows is that if you use the peak meter to adjust the maximum audio level in SC then you need to adjust the gain so that the maximum peak is below -6,2dBFS which is the meter maximum error in the 20-20000Hz band.
Something similar happened to me with this plugin that has two versions (one mono and one stereo).
FreG Fader Plugin
When I measure with the mono plugin of the stereo track, the peak value is higher.
I checked your conclusion in SC and effectively the stereo track values are higher (even on the loudness meter).
1 kHz mono sinusoidal tone track

1 kHz stereo sinusoidal tone track
Perhaps the mono peak-meter adds the 2 channels when used with a stereo track, therefore the +6dB difference.
My understanding is that we reached the point where this topic should be closed. I will start a new topic on the peak-meter.
To summarize:
- The waveform level display is correct when SC is used with stereo tracks
- The waveform level is at -3dB from real when SC is used with a mono track. This is probably not an important problem as nowadays everybody works with at least stereo tracks. And the SC development team has certainly more important matters to deal with."
Yeah, maybe.
I gave this example to illustrate that there are too many ways to measure.
Although it is not relevant to SC, in the case of this plugin, perhaps it will happen as you say.
However, Audacity’s built-in peak meter does not vary from a mono track to a stereo track.
Perhaps the developers of this plugin use some protocol that compensates for mono and stereo differences, and therefore the existence of a mono plugin and a stereo plugin.
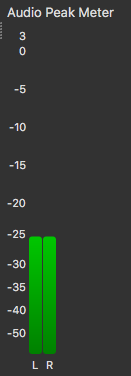
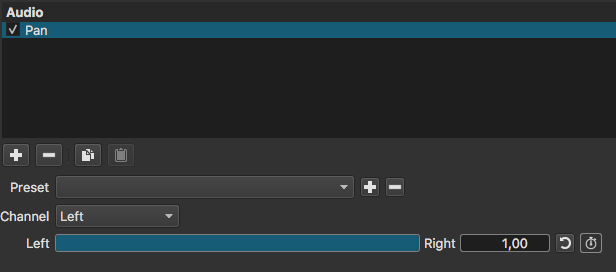
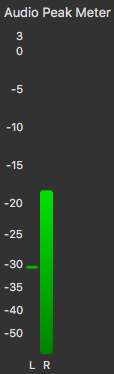
The measurement of the mono signal 1kHz sinusoidal appears in the SC meter in the two channels (L-R) perhaps detecting only one channel, there is some function that clones the existing channel and makes the peak meter show activity in the two channels (right and left), when it is not so.
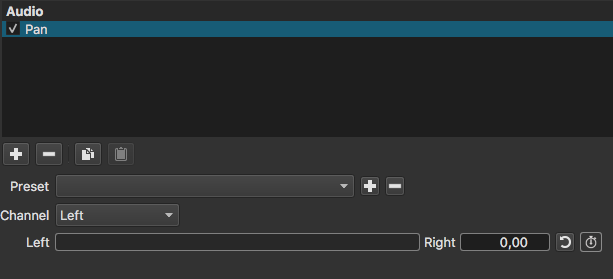
If you use the Pan filter, are the readings then “compensated” for?
“This topic will close 6 months after the last reply”, so don’t worry.
I will still publish something related here.
I’ll be watching your new thread on the peak meter.