I suppose that by frequency you mean audio frequency?
There are 3 filters that can display a visualization of the audio signal:
Audio Level Visualization
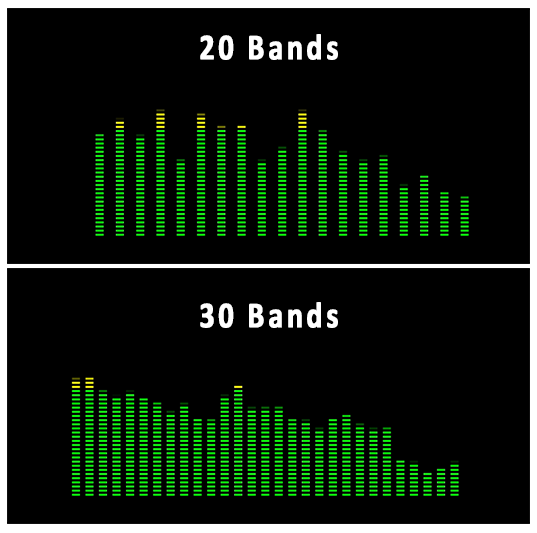
Audio Spectrum Visualization
Audio Waveform Visualization
Put your motionless image on a video track
Put your audio clip on a video track above your image.
Apply one of the 3 filters to the audio clip.
In the video below, I show only a small sample of what these filters can do. Each one has tons of settings that allows to change the look and type of visualization.
I wonder if I am doing something wrong, as I can not get this to work until I have combined that image and sound, then export. I then open up the video in Shotcut again and then add the audio filter.
@Johnny_Debt
These filters work only on video tracks. This means that you need to put your audio file (MP3, WAV, etc) on an video track and above the rest of the project.
Example:
Track V1 video and image clips
Track V2 audio clips. Apply the visualization filter(s) to the audio clip(s) on V2
Ok, I think I understand bands, pretty straightforward.
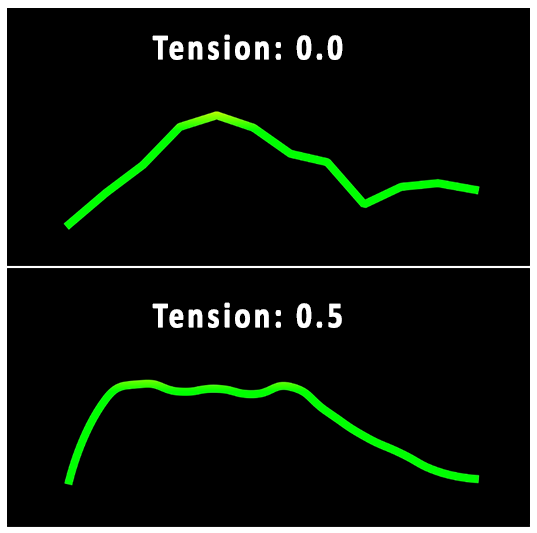
I am not sure about tension. Is tension set to great value like softly pinching somebody and they growl in max volume of they larynx and then you have have tension set to low and you have somebody who just said little “ouch”. Tell me if I understand that correctly.
yes I am fully aware they doesn’t change the sound but that still doesn’t change my question. How does this change appearance speaking, scientific speaking.
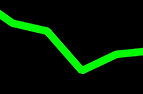
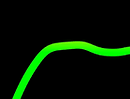
As @MusicalBox pointed out low values of tension produce disjointed lines, great for “discordant” music, while high values produce nice flowing curves, great for “esay-listening” music.