Displays a real-time frequency spectrum of the audio signal as animated lines, bars, or segments over a video frame.
Unlike level meters, this filter visualizes frequency content (low to high frequencies) rather than overall amplitude.
The visualization is rendered into the video output and reacts in real time to the audio signal, so it must be evaluated during playback rather than on a paused frame.
Important requirement (mandatory)
The audio source must be attached to a video clip.
- The filter reads audio only from the video track it is applied to.
- Video clips with embedded audio work as expected.
- Audio-only clips on audio tracks cannot drive this filter.
If no usable audio is present on the video clip, the spectrum will not animate.
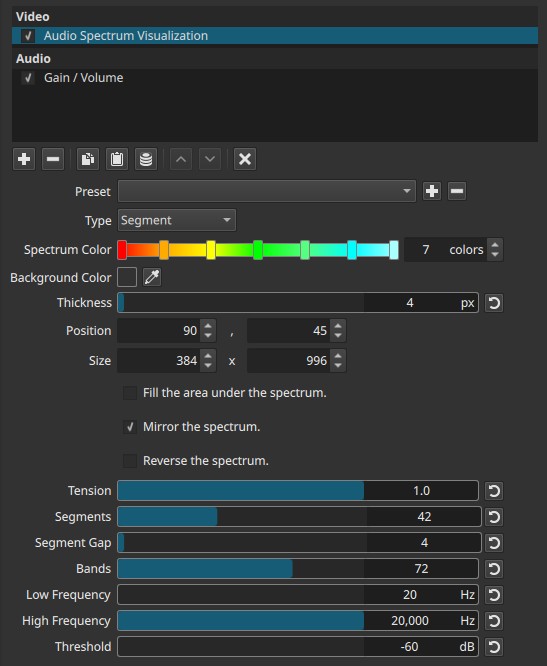
Parameters
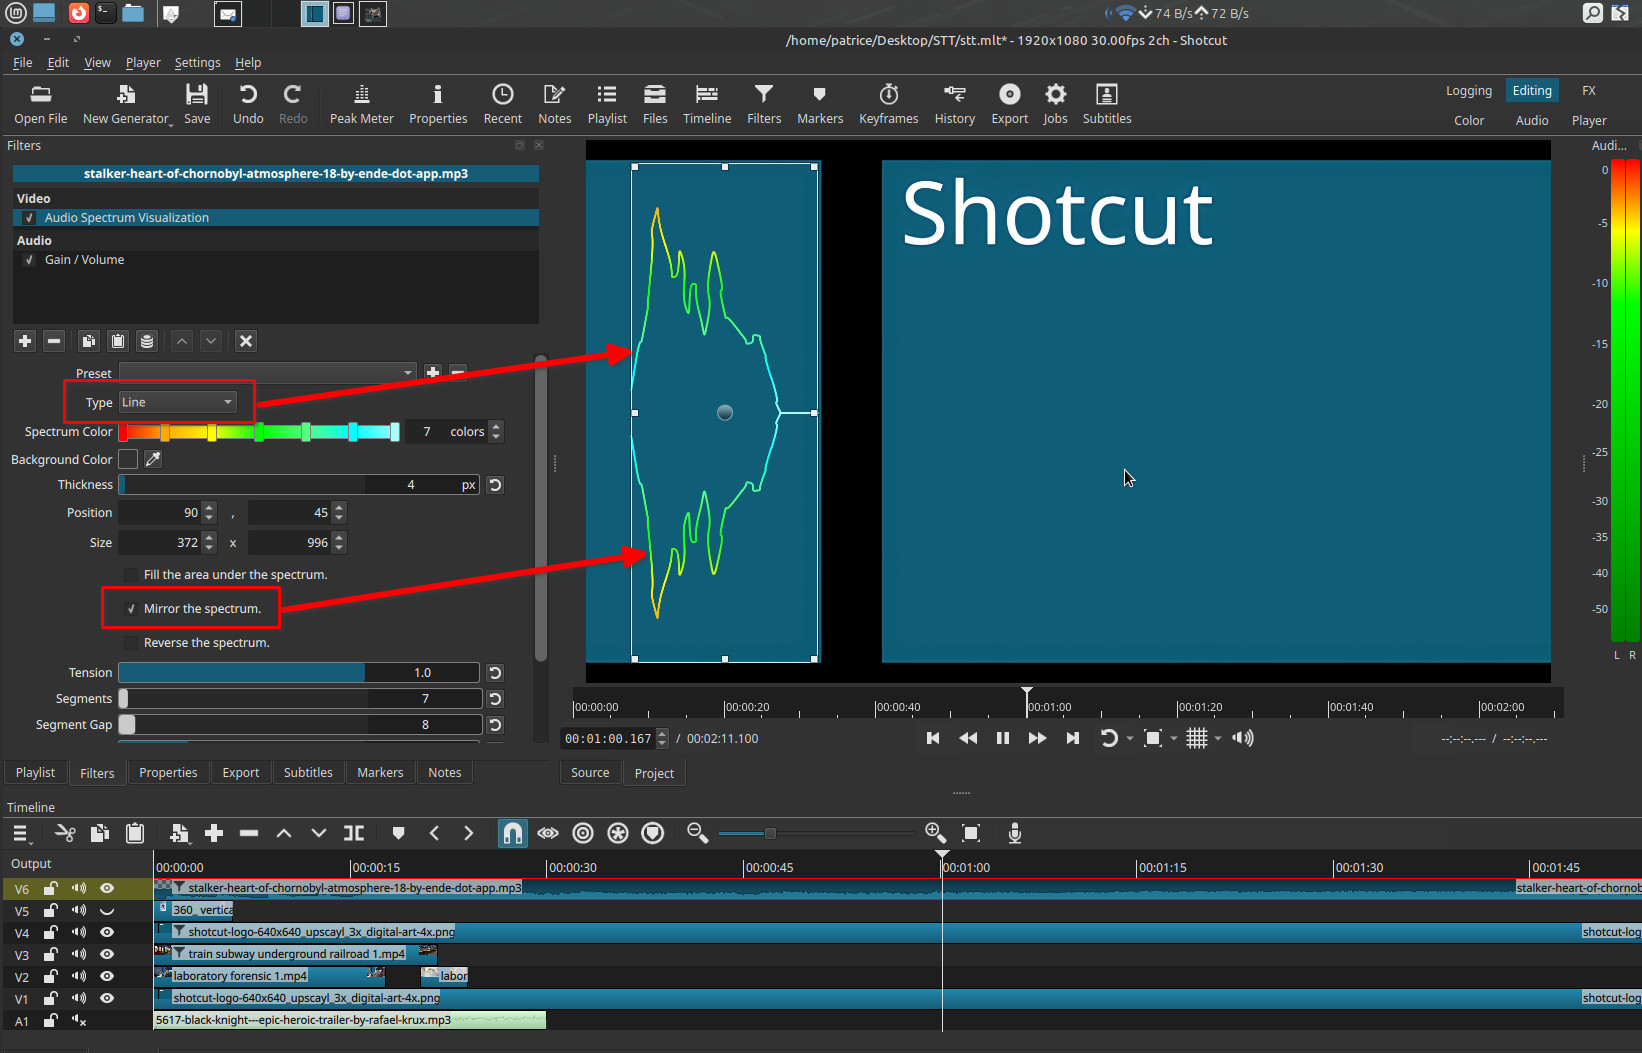
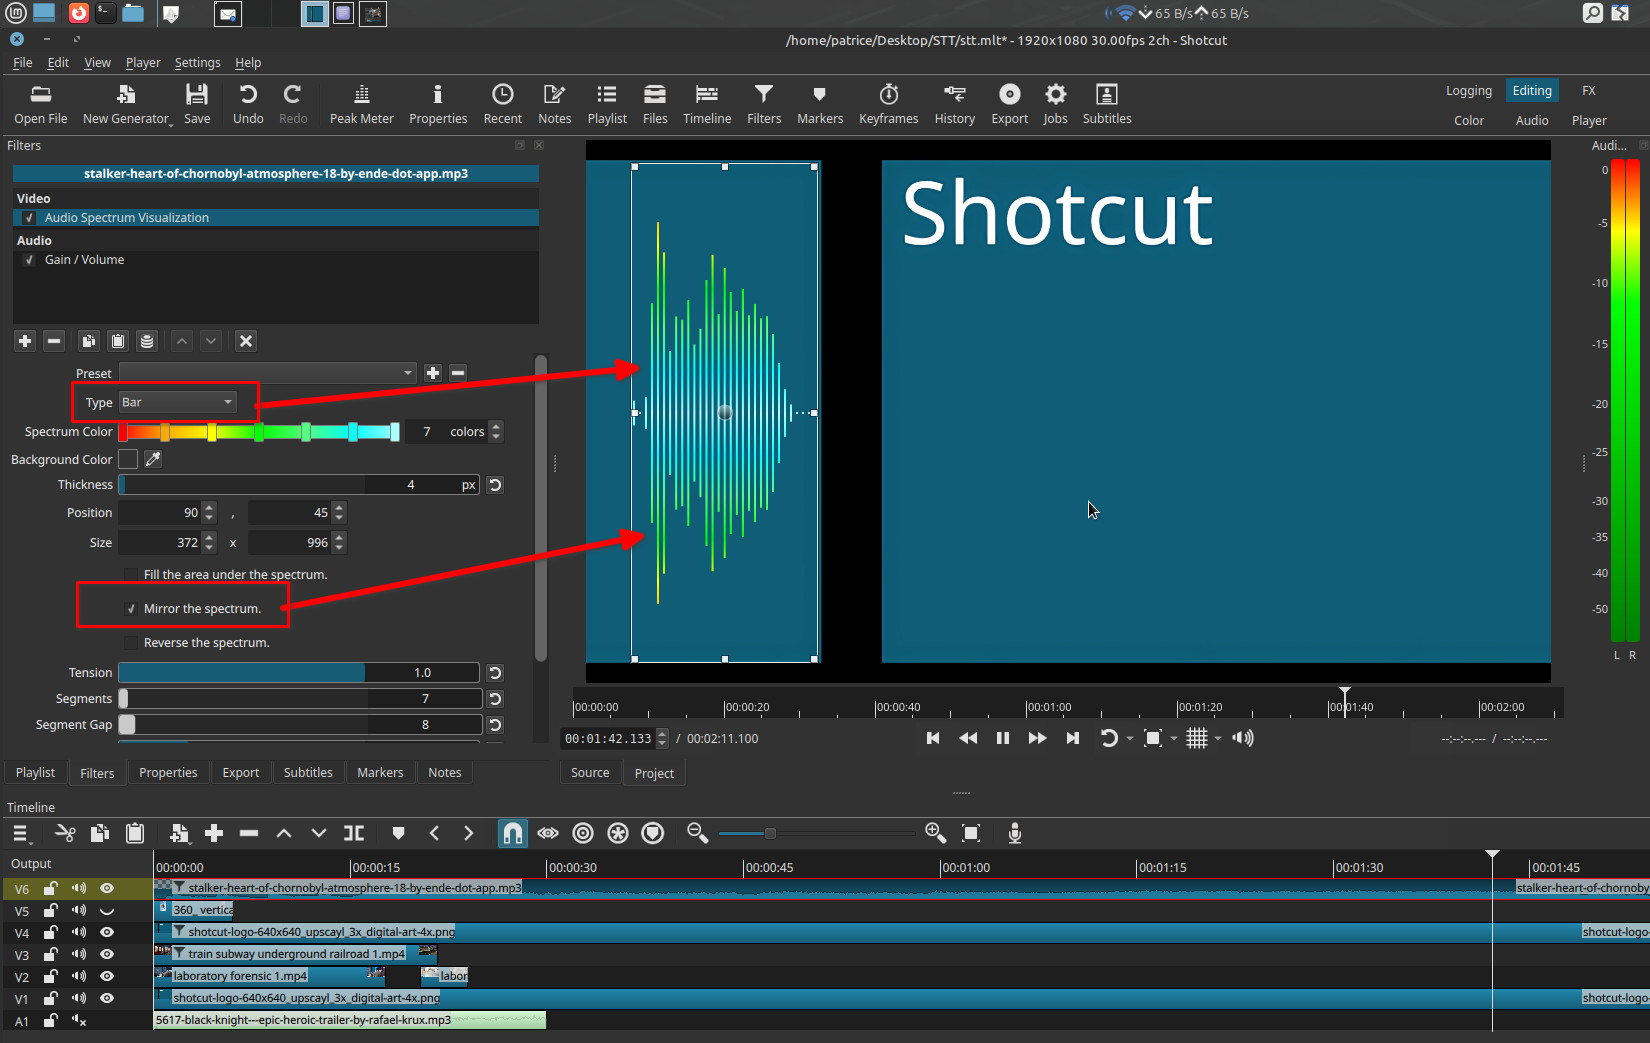
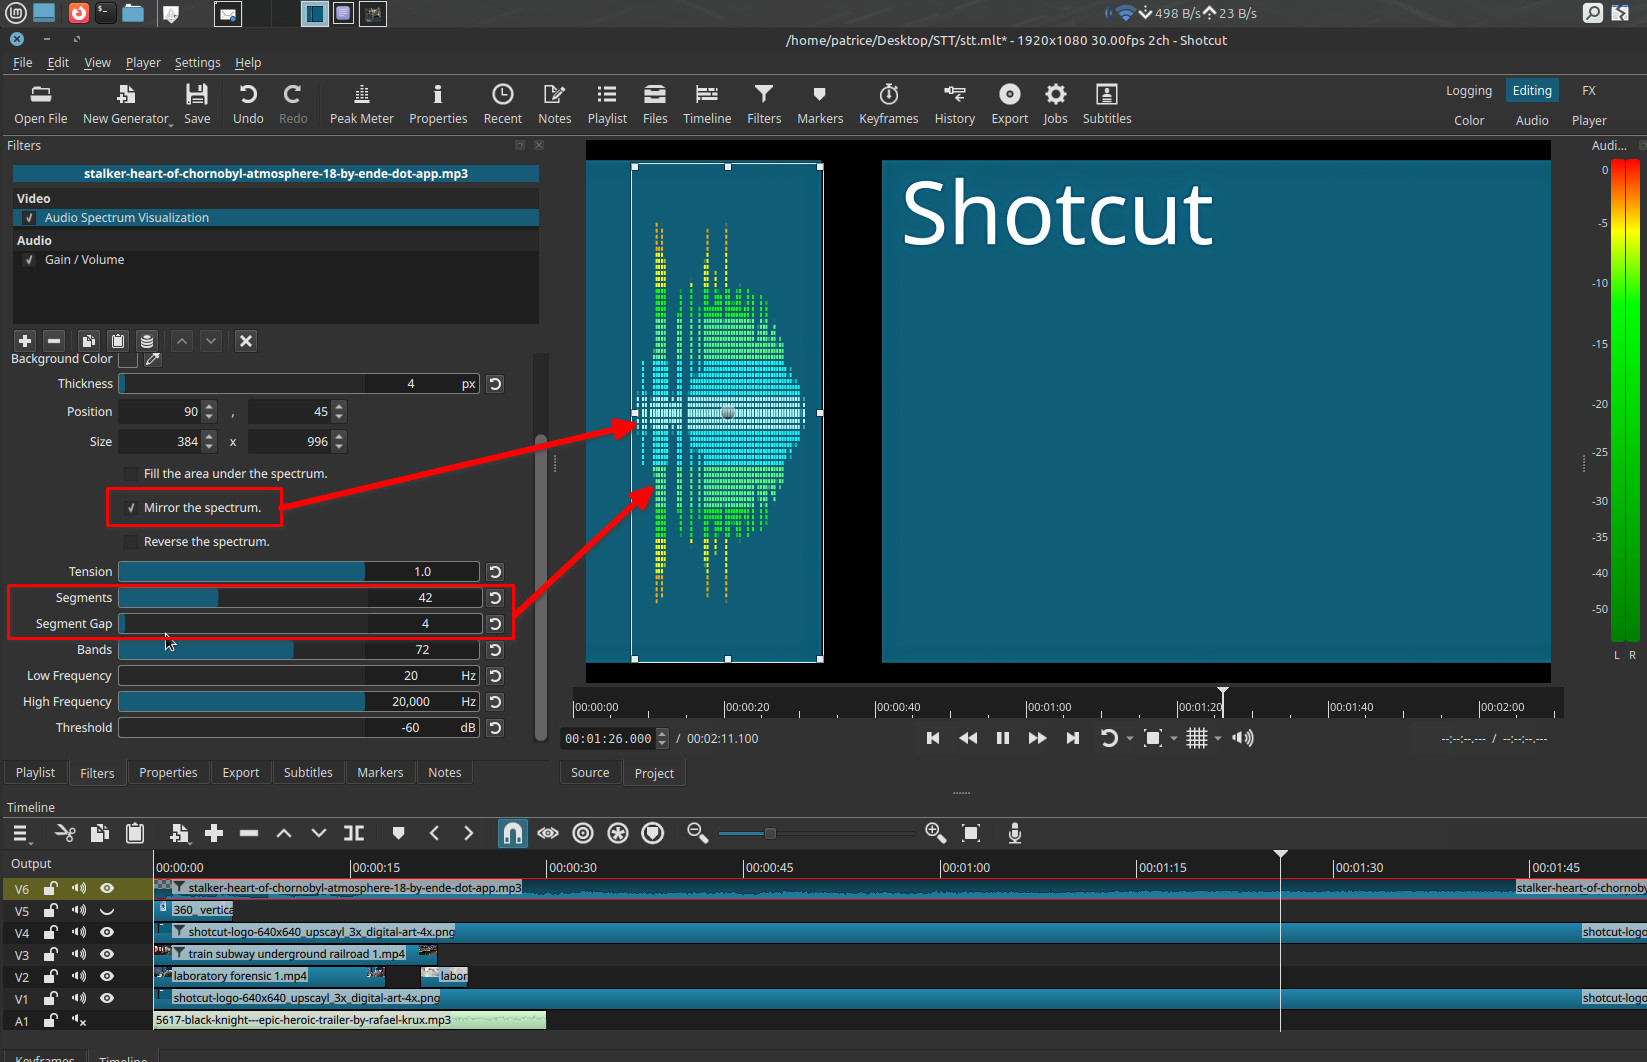
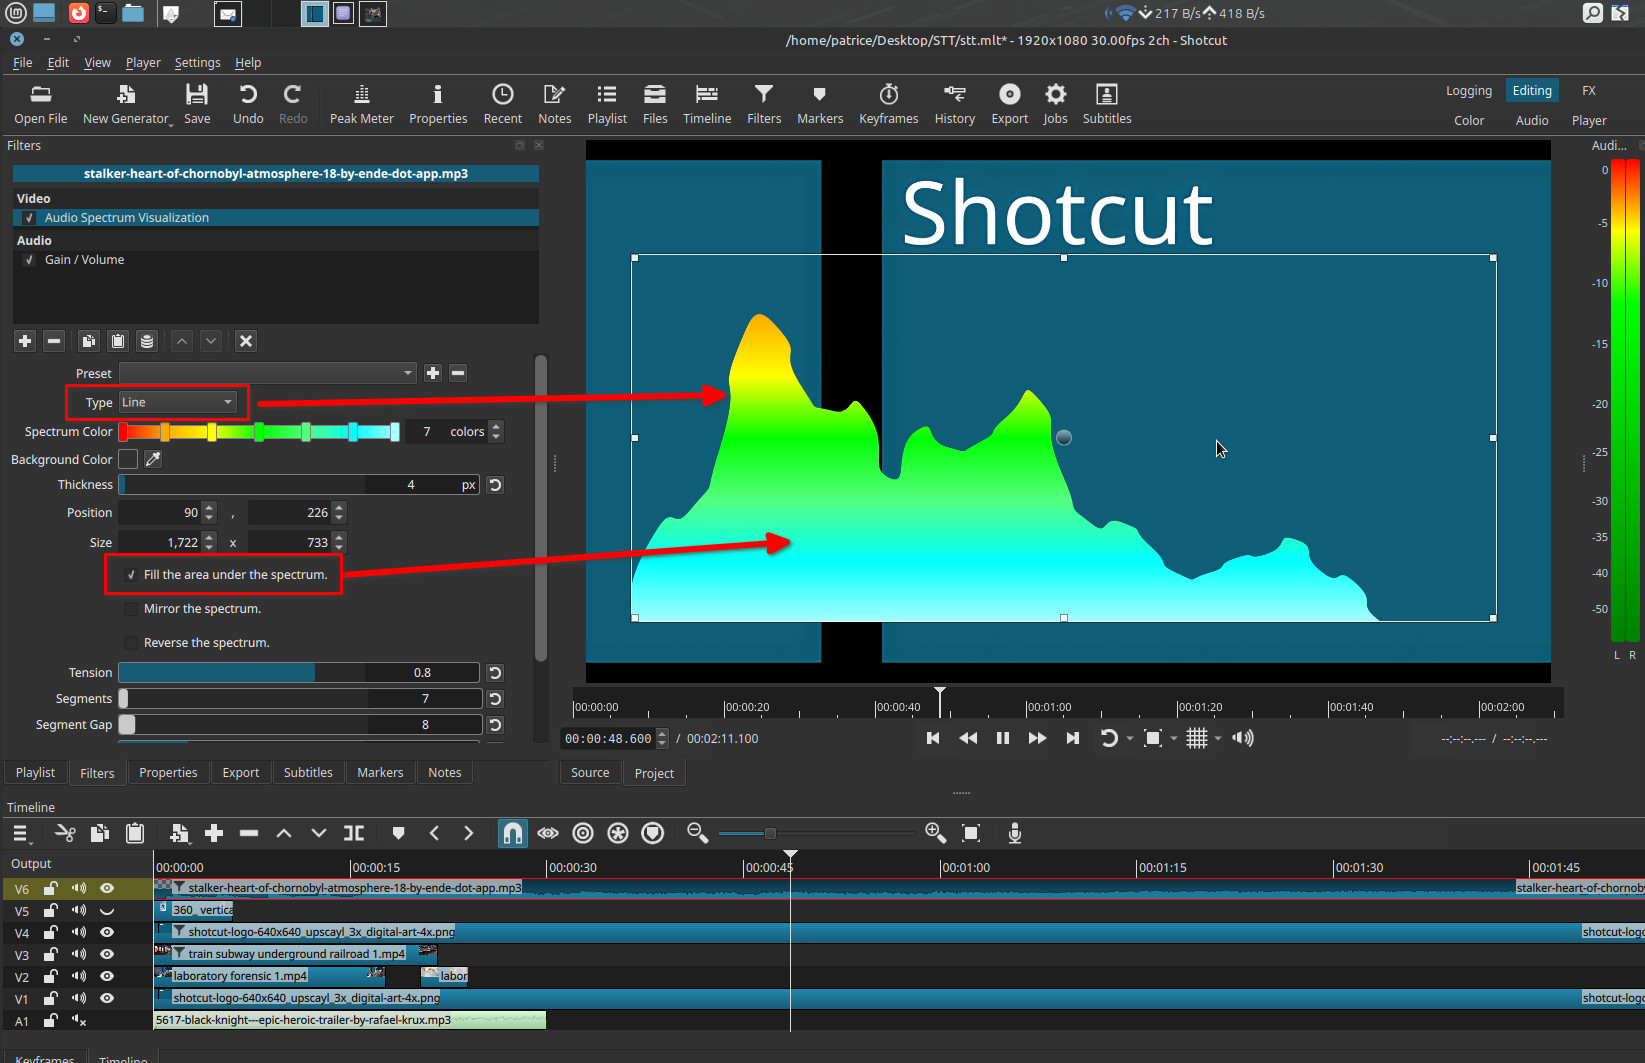
Type (Line | Bar | Segment)
Selects the visual representation of the spectrum.
- Line
A continuous curve following frequency magnitude.
- Bar
Vertical bars representing frequency bands.
- Segment
Bars divided into discrete blocks, similar to LED-style analyzers.
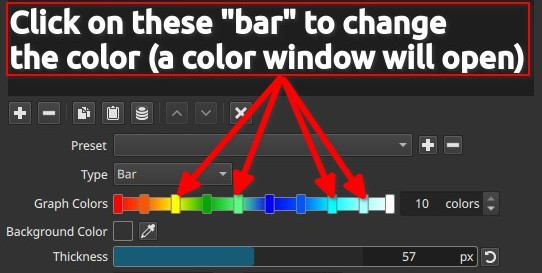
Graph Colors (1 - 10)
Defines the color ramp used to draw the spectrum.
-
You must explicitly choose the number of colors (1 to 10).
-
Click the horizontal color bar to:
- Set colors
- Adjust intermediate color stops
Important behavior
- One color → uniform spectrum color
- Multiple colors → interpolated gradient along the spectrum
Background Color
Sets the background behind the spectrum visualization.
- Default is transparent
- Can be changed using the color picker or by clicking the color control in the preview
Note:
The background is rendered into the image. Alpha transparency on export matters only when transparency is needed and the chosen format supports it.
Thickness (0 - 100 px)
Controls the stroke thickness of lines, bars, or segments.
- Affects visual weight only
- Does not change frequency resolution or sensitivity
Position (X, Y)
Sets the on-screen position of the spectrum.
- Adjustable numerically
- Can be moved directly in the preview window
Size (Width, Height)
Defines the drawing area for the spectrum.
- Adjustable numerically
- Can be resized interactively in the preview
Note:
Size defines the available space; Thickness defines how bold the spectrum appears inside it.
Fill the area under the spectrum (checkbox)
- Applies to Line mode only
- Fills the area beneath the curve using the selected Graph Colors
- Has no effect in Bar or Segment modes
Mirror the Levels (checkbox)
Mirrors the spectrum around a central horizontal axis.
- When enabled, frequencies expand upward and downward from the center
- When disabled, the spectrum grows in a single direction
This is a visual option only.
Reverse the Spectrum (checkbox)
Reverses the frequency direction.
- Low frequencies appear on the right instead of the left
- High frequencies appear on the left instead of the right
Tension (0.0 - 1.0)
Controls curve smoothing in Line mode.
-
Low values
Angular, sharp transitions between bands -
High values
Smooth, rounded curves
Important behavior
- Tension affects Line mode only.
- It has no visible effect in Bar or Segment modes.
Segments (1 - 100)
(Segment mode only)
Defines the number of discrete blocks per frequency band.
- Low values → coarse segmentation
- High values → fine segmentation
Segment Gap (0 - 100)
(Segment mode only)
Controls the spacing between segments.
- Low values → thin gaps, visually thicker segments
- High values → wide gaps, thinner-looking segments
Frequency analysis parameters
(Apply to Line, Bar, and Segment modes)
Bands (2 - 100)
Controls the number of frequency bands analyzed and displayed.
- Fewer bands → coarse frequency resolution
- More bands → finer spectral detail
Low Frequency (20 Hz - 19 000 Hz)
Defines the lowest frequency included in the spectrum.
- Raising this value removes bass content from the display
High Frequency (1020 Hz - 20 000 Hz)
Defines the highest frequency included in the spectrum.
- Lowering this value limits the display to mid or low frequencies
Threshold (-60 to 0 dB)
Sets the minimum signal level required to be displayed.
-
Lower values
More sensitivity; quiet frequencies appear -
Higher values
Less sensitivity; low-level noise is suppressed
Keyframes
This filter does not support keyframes.
All animation is driven entirely by the audio signal.
Visual characteristics
- Real-time frequency response
- Vertical frequency-based animation
- Deterministic for a given audio source
- Best evaluated during playback
Recommended use cases
- Music visualizers
- Educational audio demonstrations
- Podcast or voice-over visualization
- Audio-reactive motion graphics
Limitations
- Requires audio on a video clip
- Not a calibrated measurement tool
- No logarithmic/linear scale selection
- UI elements are rendered into the video